Here are assorted data for your perusal – unfortunately due to the government shutdown data releases are delayed or (for certain data) a month will be skipped. For example, the "Employment Situation" was scheduled for November 1st; instead it will come out November 8th. Click on charts to expand to full size. – note that except for a large (negative) blip in the unemployment data, released after this post was written, it's more of the same. With the end of the government shutdown next month will likely see a rebound in the opposite direction.
First, the first three charts on employment show a slow gain relative to age-adjusted population growth, but only slow. We still are far below normal levels of employment, and there's no particular reason to think that the fundamental structure of the labor markets and participation decisions changed over the course of a few months back in 2008-9 – no big shift in the ability to claim disability, no basic change in unemployment benefits, no change in wages [indeed, this recession reinforces the claim that wages are rigid downward, absent inflation], and I've already corrected the data for boomer retirement. That's clear if you look at the fourth chart of age-specific participation rates. Older workers – those of historic retirement age – are working more than ever [the chart gives data only from 2000, before then employment structures were relatively stable]. But in 2009 the share of people working in prime age brackets dropped, and that of younger people plummeted. Basically, while the economy is growing, it's not growing enough to eliminate the excess capacity of the Great Recession.
The fifth chart is investment. Again, we're out of the trough of 2009, but the level is still below that of some previous recessions. So more of the same: the economy is growing, but not recovering quickly.
That's not true for all sectors. As per the sixth chart, car sales have boomed; suppliers are at capacity, makers are having a hard time launching new vehicles at target levels of output. Still, we remain below the hyped level of the 2000s, and my sense is that sales are leveling out. There's still an overhang of vehicles from the go-go years, though depreciation operates far more rapidly in housing market. At the micro level I'm an example: since I'm stuck with an unsold house, we waited to replace our aging (240K miles 15 years) Volvo until the last minute – it wouldn't restart in the dealership parking lot so they gave me a tradein value lower than the local junkyard. We did buy a new car, as I judged the price differential relative to used cars too slim. However, too many people are underwater on their mortgages, median income [the point at which half the population has higher, half lower income] is falling. So my judgement is that the upside isn't going to move up very fast, despite our rising population. And while I only include the last couple years in the seventh chart, market shares have been relatively stable – with Toyota and Honda at a lower level. The eighth and final chart is of market groups. The top 4 firms have in the aggregate lost share, but over 2012-13 the Big Three and the Detroit Three have been stable.
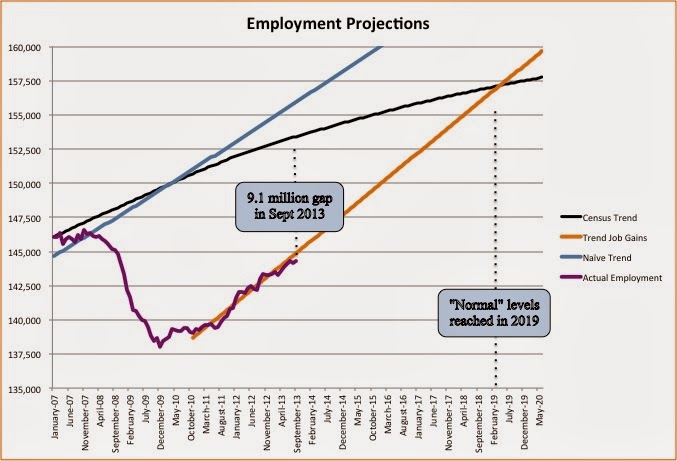
Finally, interest rates have dropped back to the new normal under the Fed's antirecessionary monetary policy. With the fears of default eased, short rates are essentially zero. Now from day to day rates jump around, but remain extraordinarily low by historic standards, all the way out to 30 years. The yield curve is flat at maturities under 5 years, but there's now a moderately steep differential at longer maturities. With rates low, this isn't reflecting expected inflation but rather that eventually the economy will recover and with it short-term interest rates will rise. The market, however, is pricing that as years away – like 3-5 years. That is unfortunately consistent with my straight-line projection of labor market growth – at the current pace the gap won't be erased until the start of 2019. While I would not be surprised to see things accelerate as the housing stock normalizes ... well, the housing stock doesn't normalize quickly: according to the IRS, which is generous in such things, depreciation takes 30 years, and with median incomes stagnant, half the population isn't in a position to upgrade their "digs". 


| Date | 1 month | 3 mo | 6 mo | 1 yr | 2 yr | 3 yr | 5 yr | 7 yr | 10 yr | 20 yr | 30 yr |
10/15/13 | 0.32 | 0.14 | 0.16 | 0.16 | 0.37 | 0.68 | 1.45 | 2.11 | 2.75 | 3.50 | 3.78 |
10/16/13 | 0.14 | 0.10 | 0.11 | 0.15 | 0.34 | 0.64 | 1.41 | 2.06 | 2.69 | 3.43 | 3.72 |
10/17/13 | 0.01 | 0.05 | 0.08 | 0.13 | 0.33 | 0.61 | 1.35 | 1.98 | 2.61 | 3.36 | 3.66 |
11/05/13 | 0.06 | 0.05 | 0.08 | 0.10 | 0.32 | 0.60 | 1.39 | 2.06 | 2.69 | 3.46 | 3.76 |
