Showing posts with label employment-population ratios. Show all posts

Thursday, 20 February 2014

Talking Macro: WREL show February 20, 2014

Here are notes from my weekly radio show on WREL Lexington, Virginia. The actual show seldom covers all of the topics I prepare, as what I discuss depends in part on questions from the host, Jim Bresnahan. What follows is thus expands on what I said or prepared to say.

The Economy

The Fed released its January minutes that suggests a pragmatic approach to policy targets. As I've discussed in previous shows, you can't capture the dynamics of the US labor market in a single number. The economists at the Fed of course know that, and so the headline item is that the Fed is revising its guidance that it will keep interest rates low unless inflation picks up or unemployment falls below 6.5%. That latter item is what is more flexible because jobs growth is not moving in parallel with the drop in unemployment.

First, the latest CPI (Consumer Price Index) report came out just after the show, and indicates no uptick inflation; prices are up a mere 1.6% over the past year once volatile food and energy prices are excluded (and as it happens, when they are included). That is consistent with the PPI (Producer Price Index) report released yesterday, with a 1.2% rise over the previous year. Both are far below historic levels, and the CPI remains well below the 2% target level with no indication that the rate is rising.

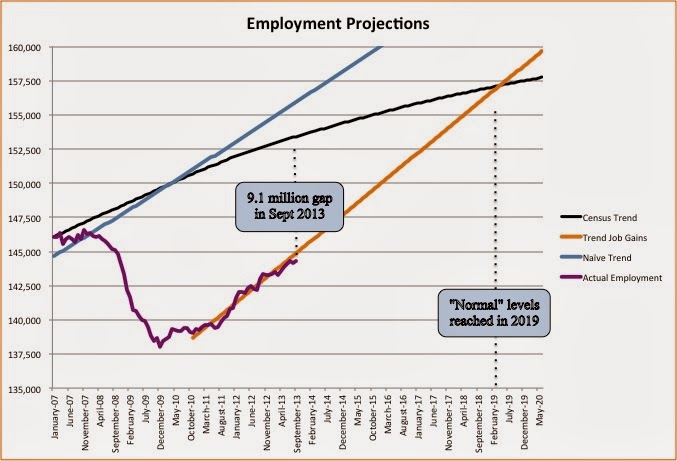
Back to employment. At present we have 145 million people employed in the US, below the 154 million level consist with population growth – a gap of 8.5 million. Worse, while my population growth number incorporates baby boomer retirement, in fact the baby boomers are not retiring at the same rate as in the past. For people aged 60-64, today 52% are employed, in 2005 only 50% were. For the older 65-69 bracket, in 2005 only 30% were working but today it's 35%. That's bad news for those at the younger end of the age bracket. In 2005 some 68% of those age 20-24 were working, but today only 62% have jobs. So the Fed is sensibly treating the unemployment number as just one more indicator, and not tying policy to a single number.

Other indicators likewise suggest muted growth. Housing starts were 880,000 in January, seasonally adjusted to reflect normal winter weather. Obviously this year's not been normal. So perhaps we'll see things pick up in Spring, but the pre-bubble level was more like 1.6 million starts (the bubble level peaked at over 2 million). But the level remains far below what we need for robust growth, and of course bad weather means that construction workers and the stores that sell to them are having a very bad start in 2014.

Finally, there's a Bloomberg story on divorce rates rising from a 40-year low in 2009. The story claims that's good news, but I'm not so sure. Yes, hard times make it more challenging for spouses to find the jobs that enable survival after a break-up. But long-term unemployment is a destroyer of families, something observed in the Great Depression of the 1930s, which left many mothers single when their men hit the road in search of work and didn't come back. But more consistent of the "economy is better" interpretation is that new household formation is rising.

That's consistent with what I've seen of my son and his friends. None of them have girlfriends, and the reason they give is that without stable jobs, it's just not a responsible thing to do. For all the decrying by their elders of today's youth, other indicators suggest the same, including a drop in children born to single mothers and in abortions.

United Way of Rockbridge update

Let me close with an update on the local United Way of Rockbridge annual campaign. While the website calendar isn't yet updated, and the thermometer outside Walmart remains on its side with the new sign blown off, we are now just shy of $220,000 or 88% of our $250,000 goal with results from Mohawk, one major employer workplace campaign, still pending. We still very much need those in our residential campaign who have procrastinated to contribute – a check to UWR at 218 S Main in Lexington (zip 24450) would be very much appreciated, and we should have a "click and contribute" button added to our web site within the next week, as we no longer want to be given credit card numbers. [Next week I will talk about our Community Leaders program, recognizing small businesses who support us.]

We also held our Annual Meeting yesterday, with reports from 16 agencies. It was both heartening and sobering to hear their reports, heartening because of the dedication of the volunteers and staff of these local community-oriented non-profits, and sobering because they too report slower contributions amidst increased demands for their services. Since we want to keep pushing ahead with our Community Impact program, Rockbridge Reads!, without cutting back on our assistance to these agencies, we really need to hit our fundraising goal.

Over the next weeks I will introduce the groups to which we contribute. One is RAOC, the Rockbridge Area Occupation Center headquartered in Buena Vista, which provides jobs to physically able but mentally challenged individuals. Now others in the area do this, Kroger and Food Lion for example employ individuals as do others, working in conjunction with the Community Services Board. So RAOC complements other efforts, running yard care and cleaning services, providing supervised work environments for individuals referred to them by the Virginia Department of Rehabilitative Services. Some of their workers are capable of using chainsaws, others are good at mowing. If you might be able to use their skills, please contact RAOC! – I provided their website link above.

Mike Smitka

Saturday, 18 January 2014

Two Further LF Graphs

While I continue to work on a blog post on Mitsubishi Motors, let me put up two further graphs on employment by age bracket, broken into (i) older workers and (ii) younger workers with January 2007 as a base. (I won't post details, but using a different base does not change things.)

First, since the share of older workers in each age bracket rises, the drop in LF participation is not due to a larger share of workers taking early retirement. Indeed, the data show just the opposite, that older workers are more likely to stay in the labor force than before the recession. (This is not a recent shift. Age breakdowns are available starting in 1994; older worker participation was rising by the late 1990s, but without a longer time series, I can't preclude that change having started earlier. Nor can I get a breakdown by gender on the BLS web site, though the BLS can likely generate those numbers.) Oh, and for a nice analysis of survey data on why people were not in the labor force, see Ellyn Terry's post on the Atlanta Fed macroblog, "What Accounts for the Decrease in the Labor Force Participation Rate?"

While I continue to work on a blog post on Mitsubishi Motors, let me put up two further graphs on employment by age bracket, broken into (i) older workers and (ii) younger workers with January 2007 as a base. (I won't post details, but using a different base does not change things.)

First, since the share of older workers in each age bracket rises, the drop in LF participation is not due to a larger share of workers taking early retirement. Indeed, the data show just the opposite, that older workers are more likely to stay in the labor force than before the recession. (This is not a recent shift. Age breakdowns are available starting in 1994; older worker participation was rising by the late 1990s, but without a longer time series, I can't preclude that change having started earlier. Nor can I get a breakdown by gender on the BLS web site, though the BLS can likely generate those numbers.)

In contrast, the participation of prime-age workers fell sharply (and that of teens is literally off the chart, so not included). Furthermore, there been at best a modest recovery so far, but no marked decline in any recent month beyond what could be noise. (I graphed a moving average of the number of the 13 age brackets for which the monthly change is negative; overall that's been around 5 for the past 20 years, and is about that now.)

So if the overall participation rate is falling, but each component is flat or rising, then that has to be a consequence of the population aging, shifting from high participation brackets to lower ones (age 55 and above).

Friday, 17 January 2014

(un) Employment

The latest Current Population Survey (and Current Employment Survey) data show a labor market that barely grew, once you account for demographics. Earlier posts (most recently Auto Recovery, yes ... but as for the rest) provide snapshots of employment and employment corrected for involuntary short hours, both relative to an employment-propensity weighted population projection. Here's another cut, shifts in age-specific ratios of employment to population. That helps correct for the aging of the baby boomers (but misses shifts in people on involuntary short hours). Unfortunately BLS doesn't post these ratios broken down by gender. Anyway, here are the data for January 2009 through December 2013; they provide a "cut" that doesn't seem to be widely reported but is a useful complement to those that are.

Wednesday, 6 November 2013

Data update: November 2013

Here are assorted data for your perusal – unfortunately due to the government shutdown data releases are delayed or (for certain data) a month will be skipped. For example, the "Employment Situation" was scheduled for November 1st; instead it will come out November 8th. Click on charts to expand to full size. – note that except for a large (negative) blip in the unemployment data, released after this post was written, it's more of the same. With the end of the government shutdown next month will likely see a rebound in the opposite direction.   

First, the first three charts on employment show a slow gain relative to age-adjusted population growth, but only slow. We still are far below normal levels of employment, and there's no particular reason to think that the fundamental structure of the labor markets and participation decisions changed over the course of a few months back in 2008-9 – no big shift in the ability to claim disability, no basic change in unemployment benefits, no change in wages [indeed, this recession reinforces the claim that wages are rigid downward, absent inflation], and I've already corrected the data for boomer retirement. That's clear if you look at the fourth chart of age-specific participation rates. Older workers – those of historic retirement age – are working more than ever [the chart gives data only from 2000, before then employment structures were relatively stable]. But in 2009 the share of people working in prime age brackets dropped, and that of younger people plummeted. Basically, while the economy is growing, it's not growing enough to eliminate the excess capacity of the Great Recession.

The fifth chart is investment. Again, we're out of the trough of 2009, but the level is still below that of some previous recessions. So more of the same: the economy is growing, but not recovering quickly.

That's not true for all sectors. As per the sixth chart, car sales have boomed; suppliers are at capacity, makers are having a hard time launching new vehicles at target levels of output. Still, we remain below the hyped level of the 2000s, and my sense is that sales are leveling out. There's still an overhang of vehicles from the go-go years, though depreciation operates far more rapidly in housing market. At the micro level I'm an example: since I'm stuck with an unsold house, we waited to replace our aging (240K miles 15 years) Volvo until the last minute – it wouldn't restart in the dealership parking lot so they gave me a tradein value lower than the local junkyard. We did buy a new car, as I judged the price differential relative to used cars too slim. However, too many people are underwater on their mortgages, median income [the point at which half the population has higher, half lower income] is falling. So my judgement is that the upside isn't going to move up very fast, despite our rising population. And while I only include the last couple years in the seventh chart, market shares have been relatively stable – with Toyota and Honda at a lower level. The eighth and final chart is of market groups. The top 4 firms have in the aggregate lost share, but over 2012-13 the Big Three and the Detroit Three have been stable.

Finally, interest rates have dropped back to the new normal under the Fed's antirecessionary monetary policy. With the fears of default eased, short rates are essentially zero. Now from day to day rates jump around, but remain extraordinarily low by historic standards, all the way out to 30 years. The yield curve is flat at maturities under 5 years, but there's now a moderately steep differential at longer maturities. With rates low, this isn't reflecting expected inflation but rather that eventually the economy will recover and with it short-term interest rates will rise. The market, however, is pricing that as years away – like 3-5 years. That is unfortunately consistent with my straight-line projection of labor market growth – at the current pace the gap won't be erased until the start of 2019. While I would not be surprised to see things accelerate as the housing stock normalizes ... well, the housing stock doesn't normalize quickly: according to the IRS, which is generous in such things, depreciation takes 30 years, and with median incomes stagnant, half the population isn't in a position to upgrade their "digs".

Date1 month3 mo6 mo1 yr2 yr3 yr5 yr7 yr10 yr20 yr30 yr
10/15/13
0.32
0.14
0.16
0.16
0.37
0.68
1.45
2.11
2.75
3.50
3.78
10/16/13
0.14
0.10
0.11
0.15
0.34
0.64
1.41
2.06
2.69
3.43
3.72
10/17/13
0.01
0.05
0.08
0.13
0.33
0.61
1.35
1.98
2.61
3.36
3.66
11/05/13
0.06
0.05
0.08
0.10
0.32
0.60
1.39
2.06
2.69
3.46
3.76

Saturday, 3 August 2013

June data update

Here are 3 charts from Friday's release of (un)employment and auto sales data. First, looking at employment-population ratios shows very little recovery, and no obvious trend towards improvement. Second, auto industry employment is up – but again, we're still far short of previous levels. Finally, auto market shares by broad groups are relatively stable, despite the ups and downs of the last 5 years. However, the Big Three – GM, Ford, Toyota – are down a bit, as are Japanese firms in the aggregate. That's because of modest gains by German and Korean firms (data not shown).   [click graphs to enlarge]

mike smitka